

Over the past couple of years, a lot of people have had a hard time buying a home. And while affordability is still tight, there are signs it’s getting a little better and might keep improving throughout the rest of the year.
Lawrence Yun, Chief Economist at the National Association of Realtors (NAR), says:
“Housing affordability is improving ever so modestly, but it is moving in the right direction.”
Here’s a look at the latest data on the three biggest factors affecting home affordability — Mortgage Rates, Home Prices, and Wages:
1. Mortgage Rates
Mortgage rates have been volatile this year, bouncing around from the mid-6% to low 7% range. But there’s some good news. Data from Freddie Mac shows rates have been trending down overall since May (see graph below):
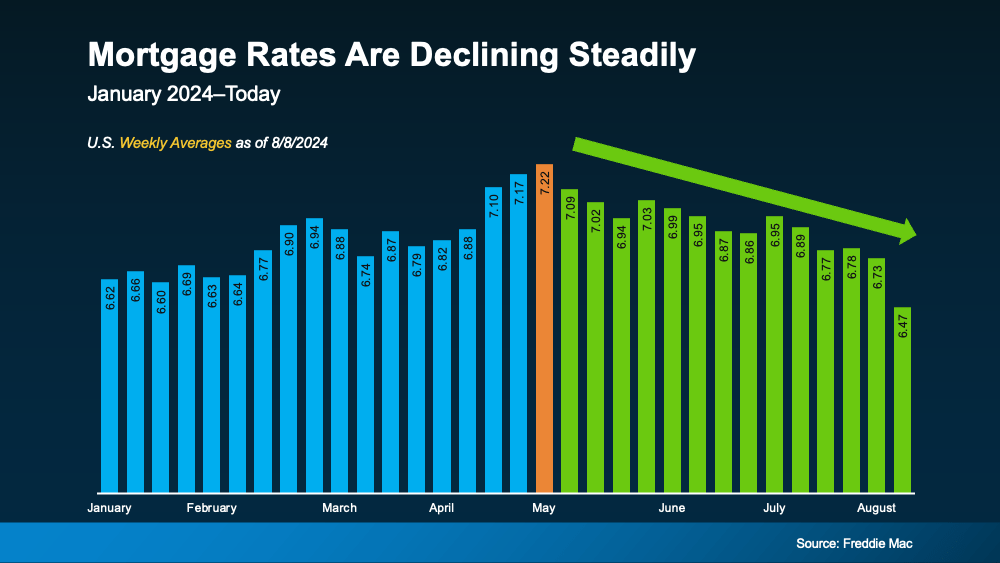
Mortgage rates have improved lately in part because of recent economic, employment, and inflation data. Moving forward, some rate volatility is to be expected. But if future economic data continues to show signs of cooling, experts say mortgage rates could keep going down.
Even a small drop can help you out. When rates decline, it’s easier to afford the home you want because your monthly payment will be lower. Just don’t expect them to go back down to 3%.
2. Home Prices
The second big thing to think about is home prices. Nationally, they’re still going up this year, but not as fast as they did a couple of years ago. The graph below uses home price data from Case-Shiller to illustrate that point:
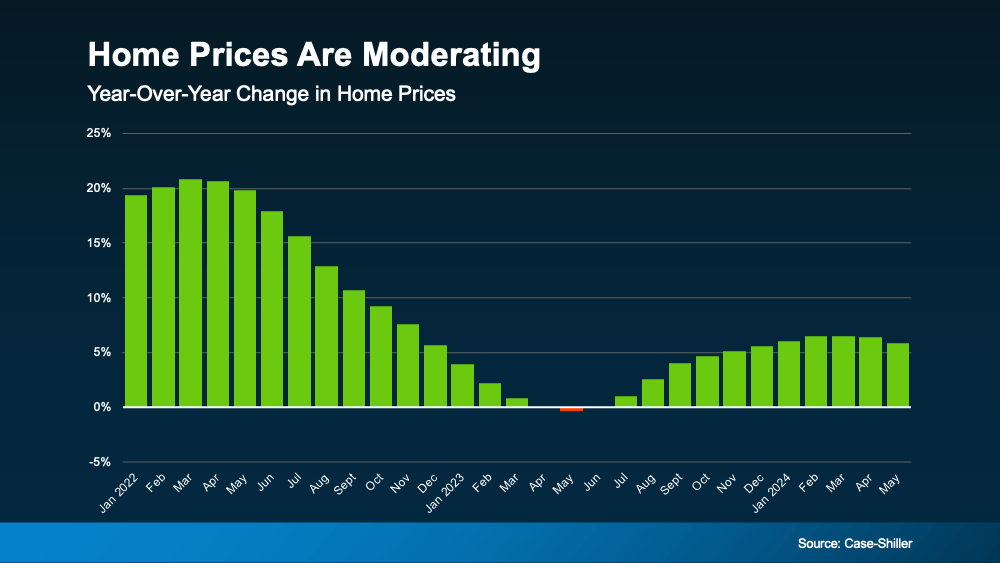
If you’re thinking about buying a home, slower price growth is good news. Home prices went up a lot during the pandemic, making it hard for many people to buy. Now, with prices rising more slowly, buying a home may feel less out of reach. As Odeta Kushi, Deputy Chief Economist at First American, says:
“While housing affordability is low for potential first-time home buyers, slowing price appreciation and lower mortgage rates could help – so the dream of homeownership isn’t boarded up just yet.”
3. Wages
Another factor helping with affordability is rising wages. The graph below uses data from the Bureau of Labor Statistics (BLS) to show how wages have increased over time:
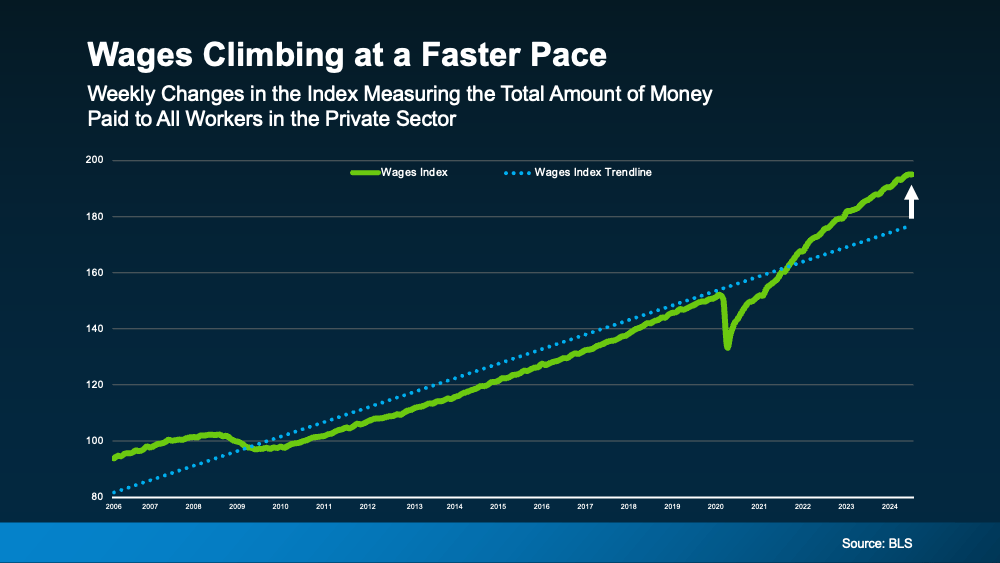
Look at the blue dotted line. It shows how wages usually go up in a typical year. On the right side of the graph, you’ll see wages are rising even faster than normal right now – that’s the green line.
This helps you because if your income increases, it’s easier to afford a home. That’s because you won’t have to spend as much of your paycheck on your monthly mortgage payment.
Bottom Line
When you put all these factors together, you see mortgage rates are trending down, home prices are rising more slowly, and wages are going up faster than usual. Though affordability is still a challenge, these trends are early signs things might be starting to improve.
The information contained, and the opinions expressed in articles, videos, or infographics posted or shared by the Staten Island Board of Realtors® (SIBOR) and/or the Staten Island Multiple Listing Service Inc. (SIMLS) are not intended to be construed as investment advice. SIBOR and SIMLS do not guarantee or warrant the accuracy or completeness of the information or opinions contained herein. Nothing herein should be construed as investment advice. You should always conduct your own research and due diligence and obtain professional advice before making any investment decision. SIBOR and SIMLS will not be liable for any loss or damage caused by your reliance on the information or opinions contained herein.


